Central Tendency:
Data can be classified in various
forms. One way to distinguish between data is in terms of grouped and ungrouped
data.
What is ungrouped data?
When the data has not been placed in any categories and no
aggregation/summarization has taken placed on the data then it is known as
ungrouped data. Ungrouped data is also known as raw data.
Height of students:
(171,161,155,155,183,191,185,170,172,177,183,190,139,149,150,
150,152,158,159,174,178,179,190,170,143,165,167,187,169,182,
163,149,174,174,177,181,170,182,170,145,143):
This
is raw/ungrouped data.
When raw data have been grouped in
different classes then it is said to be grouped data.
Height of students:
(139,
143, 143, 145, 149, 149,150,150,152, 155,155, 158,159, 161, 163, 165,167, 169,
170, 170, 170 170, 171, 172, 174, 174,174, 177, 177, 178,179, 181, 182, 182,
183, 183, 185, 187, 190, 190, 191)
Before we study more about grouped
and ungrouped data it is important to understand what do we mean by “Central
Tendencies”?
Measures
of central tendency
These are statistical constants which give us an idea about the
concentration of the values in the central part of the distribution. The
various measures of central tendency are: - Arithmetic Mean
- Median
- Mode
- Gerometric Mean
- Harmonic Mean
Arithmetic mean of a set of observations is their sum divided by
the number of observations, E.g., the Arithmetic mean $\bar{x}$ of $n$ observations $x_1, x_2, x_3,........, x_n$ is given by
$\bar{x}=\frac{x_1+x_2+x_3+....+x_n}{n}=\frac{1}{n}\sum_{i=1}^n x_i$ (Ungrouped data)
In case of frequency distribution $\ x_i, f_i, i=1,2,3,......, n$ where $\ f_i$ is the frequency of the variable $\ x_i$
$\bar{x}$=$\frac{f_1x_1+f_2x_2+f_3x_3+.......+f_nx_n}{f_1+f_2+f_3+.......+f_nx_n}$=$\frac{\sum_{i=1}^n f_ix_i}{\sum_{i=1}^n f_i}$ (Grouped Data with frequency Distribution)
In case of continuous frequency distribution, $x$ is taken as the mid value of the corresponding class.
Example: Find the arithmetic mean of the following distribution
(a) x: 150,200,300,650,250,180,400,500,550,220
Solution (a): Here the data is group data. So the arithmetic mean is
$\bar{x}$ = $\frac{150+200+300+650+250+180+400+500+550+220}{10}$=340
Solution (b) : Here the given data are grouped data with discrete frequency distribution. So the arithmetic mean is
$\bar{x}$=$\frac{1\times5+2\times9+3\times12+4\times17+5\times14+6\times10+7\times6}{5+9+12+17+14+10+6}$=4.09
Example: Find the arithmetic mean of the following distribution
If the values of $x$ or $f$ are large, the calculation of mean is quite time consuming and tedious. The arithmetic is required to a great extent by taken deviations of the given values from any arbitrary point "A".
$d_i$ = $x_i - A$ ⇒$\sum_{i=1}^n d_i$ = $\sum_{i=1}^n x_i - A_n$
Now ,
$\frac{\sum_{i=1}^n d_i}{n}$ = $\frac{\sum_{i=1}^n x_i}{n}$ - $A$
$\bar{x}$ = $A$ + $\frac{\sum_{i=1}^n d_i}{n}$ (for ungrouped data)
$\bar{x}$ = $A$+$\frac{1}{N}{\sum f_id_i}$ where $N$=$\sum f_i$
$d_i$ = $\frac{x_i-A}{h}$
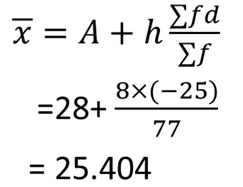
$\bar{x}$= $A$+$\frac{h}{N}{\sum f_id_i}$ where, $N$= $\sum f_i$
Example : Calculate the mean for the following frequency distribution
Example : The average salary of male employees in a firm was Rs. 5,200 and that of female was Rs. 4,200. The mean salary of all the employees was Rs. 5000. Find the percentage of male and female employees.